Example 2: Dataframes
This Example demonstrates the capabilities of the class Dataframes_SIR3S_Model that extends SIR3S_Model be abilities to work directley with pandas dataframes.
Toolkit Release
[1]:
#pip install
Imports
SIR 3S Toolkit
Regular Import/Init
[2]:
SIR3S_SIRGRAF_DIR = r"C:\3S\SIR 3S Entwicklung\SirGraf-90-15-00-19_x64" #change to local path
[3]:
from sir3stoolkit.core import wrapper
[4]:
wrapper
[4]:
<module 'sir3stoolkit.core.wrapper' from 'C:\\Users\\aUsername\\3S\\sir3stoolkit\\src\\sir3stoolkit\\core\\wrapper.py'>
[5]:
wrapper.Initialize_Toolkit(SIR3S_SIRGRAF_DIR)
Additional Import/Init for Dataframes class
from sir3stoolkit.mantle import dataframe
We can just import the whole mantle to get all higher level modeling functions.
[6]:
from sir3stoolkit.mantle import mantle
[7]:
s3s = mantle.Mantle_SIR3S_Model()
Initialization complete
[8]:
from sir3stoolkit.mantle import mantle
[9]:
s3s = mantle.Mantle_SIR3S_Model()
Initialization complete
Additional
[ ]:
import pandas as pd
from shapely.geometry import Point
import re
import folium
from folium.plugins import HeatMap
import numpy as np
import geopandas as gpd
from shapely import wkt
import matplotlib.pyplot as plt
import contextily as cx
Open Model
[11]:
s3s.OpenModel(dbName=r"C:\Users\aUsername\3S\PT3S\PT3S\Examples\Example3.db3",
              providerType=s3s.ProviderTypes.SQLite,
              Mid="M-1-0-1",
              saveCurrentlyOpenModel=False,
              namedInstance="",
              userID="",
              password="")
Model is open for further operation
Prepare Data
District Heating Consumer
Metadata
[12]:
df_consumer_metadata=s3s.generate_element_metadata_dataframe(element_type=s3s.ObjectTypes.DistrictHeatingConsumer, properties=[], geometry=True)
[2025-10-17 13:22:33,659] INFO in sir3stoolkit.mantle.dataframes: [metadata] Generating metadata dataframe for element type: ObjectTypes.DistrictHeatingConsumer
[2025-10-17 13:22:33,667] INFO in sir3stoolkit.mantle.dataframes: [metadata] Retrieved 337 element(s) of element type ObjectTypes.DistrictHeatingConsumer.
[2025-10-17 13:22:33,691] DEBUG in sir3stoolkit.mantle.dataframes: [Resolving Metadata Properties] Using 0 metadata properties.
[2025-10-17 13:22:33,692] INFO in sir3stoolkit.mantle.dataframes: [metadata] Retrieving geometry...
[2025-10-17 13:22:33,724] INFO in sir3stoolkit.mantle.dataframes: [metadata] 0 non-empty end node columns were created)
[2025-10-17 13:22:33,726] INFO in sir3stoolkit.mantle.dataframes: [metadata] Done. Shape: (337, 2)
[13]:
df_consumer_metadata.head(3)
[13]:
| tk | geometry | |
|---|---|---|
| 0 | 4743997951091160959 | POINT (713181.847468032 5578489.9250612) |
| 1 | 5014209100699808035 | POINT (713369.326806115 5578395.12330167) |
| 2 | 4627580049017248376 | POINT (713251.536184149 5578455.25247764) |
Result Data
[14]:
df_consumer_results=s3s.generate_element_results_dataframe(s3s.ObjectTypes.DistrictHeatingConsumer, ["W"])
[2025-10-17 13:22:33,759] INFO in sir3stoolkit.mantle.dataframes: [results] Generating results dataframe for element type: ObjectTypes.DistrictHeatingConsumer
[2025-10-17 13:22:33,760] INFO in sir3stoolkit.mantle.dataframes: [Resolving Timestamps] No timestamps were given. Checking available simulation timestamps (SIR3S_Model.GetTimeStamps()).
[2025-10-17 13:22:33,868] INFO in sir3stoolkit.mantle.dataframes: 25 simulation timestamps will be used.
[2025-10-17 13:22:33,938] INFO in sir3stoolkit.mantle.dataframes: [Resolving Timestamps] 25 valid timestamps will be used.
[2025-10-17 13:22:33,938] INFO in sir3stoolkit.mantle.dataframes: [results] Retrieved 337 tks.
[2025-10-17 13:22:33,942] INFO in sir3stoolkit.mantle.dataframes: [results] Using 1 result properties.
[2025-10-17 13:22:33,943] INFO in sir3stoolkit.mantle.dataframes: [results] Retrieving result properties...
[2025-10-17 13:22:34,704] INFO in sir3stoolkit.mantle.dataframes: [results] Done. Shape: (8425, 3)
[15]:
df_consumer_results.head(3)
[15]:
| timestamp | tk | W | |
|---|---|---|---|
| 0 | 2023-02-13 00:00:00.000 +01:00 | 4743997951091160959 | 0 |
| 1 | 2023-02-13 00:00:00.000 +01:00 | 5014209100699808035 | 0 |
| 2 | 2023-02-13 00:00:00.000 +01:00 | 4627580049017248376 | 0 |
Merge
[16]:
df_consumer = pd.merge(
    df_consumer_metadata,
    df_consumer_results,
    on="tk",
    how="outer"
)
[17]:
df_consumer.head(3)
[17]:
| tk | geometry | timestamp | W | |
|---|---|---|---|---|
| 0 | 4611752310942477664 | POINT (713675.30023234 5578705.1927566) | 2023-02-13 00:00:00.000 +01:00 | 39.3675 |
| 1 | 4611752310942477664 | POINT (713675.30023234 5578705.1927566) | 2023-02-13 01:00:00.000 +01:00 | 39.83363 |
| 2 | 4611752310942477664 | POINT (713675.30023234 5578705.1927566) | 2023-02-13 02:00:00.000 +01:00 | 40.48209 |
Pipes
Metadata
[18]:
df_pipes_metadata=s3s.generate_element_metadata_dataframe(element_type=s3s.ObjectTypes.Pipe, properties=["DN", "Kvr"], geometry=True, end_nodes=True)
[2025-10-17 13:22:34,775] INFO in sir3stoolkit.mantle.dataframes: [metadata] Generating metadata dataframe for element type: ObjectTypes.Pipe
[2025-10-17 13:22:34,784] INFO in sir3stoolkit.mantle.dataframes: [metadata] Retrieved 524 element(s) of element type ObjectTypes.Pipe.
[2025-10-17 13:22:34,786] DEBUG in sir3stoolkit.mantle.dataframes: [Resolving Metadata Properties] Using 2 metadata properties.
[2025-10-17 13:22:34,787] INFO in sir3stoolkit.mantle.dataframes: [metadata] Retrieving metadata properties ['DN', 'Kvr'], geometry, end nodes...
[2025-10-17 13:22:34,979] INFO in sir3stoolkit.mantle.dataframes: [metadata] 2 non-empty end node columns were created)
[2025-10-17 13:22:34,979] INFO in sir3stoolkit.mantle.dataframes: [metadata] Done. Shape: (524, 6)
[19]:
df_pipes_metadata.head(3)
[19]:
| tk | DN | Kvr | geometry | fkKI | fkKK | |
|---|---|---|---|---|---|---|
| 0 | 5442010239090746007 | 150 | 1 | LINESTRING (713620.267807079 5578828.41875394,... | 5669301360686511351 | 5397948523091900401 |
| 1 | 4917786378639043296 | 125 | 1 | LINESTRING (713602.294599536 5578860.10567987,... | 5397948523091900401 | 5239335112004772156 |
| 2 | 4762482310382009633 | 125 | 1 | LINESTRING (713574.061626605 5578909.87290685,... | 5239335112004772156 | 5298886695042021307 |
Result data
[20]:
df_pipes_results=s3s.generate_element_results_dataframe(s3s.ObjectTypes.Pipe, ["QMAV"])
[2025-10-17 13:22:35,016] INFO in sir3stoolkit.mantle.dataframes: [results] Generating results dataframe for element type: ObjectTypes.Pipe
[2025-10-17 13:22:35,018] INFO in sir3stoolkit.mantle.dataframes: [Resolving Timestamps] No timestamps were given. Checking available simulation timestamps (SIR3S_Model.GetTimeStamps()).
[2025-10-17 13:22:35,189] INFO in sir3stoolkit.mantle.dataframes: 25 simulation timestamps will be used.
[2025-10-17 13:22:35,287] INFO in sir3stoolkit.mantle.dataframes: [Resolving Timestamps] 25 valid timestamps will be used.
[2025-10-17 13:22:35,315] INFO in sir3stoolkit.mantle.dataframes: [results] Retrieved 524 tks.
[2025-10-17 13:22:35,319] INFO in sir3stoolkit.mantle.dataframes: [results] Using 1 result properties.
[2025-10-17 13:22:35,319] INFO in sir3stoolkit.mantle.dataframes: [results] Retrieving result properties...
[2025-10-17 13:22:37,094] INFO in sir3stoolkit.mantle.dataframes: [results] Done. Shape: (13100, 3)
[21]:
df_pipes_results.head(3)
[21]:
| timestamp | tk | QMAV | |
|---|---|---|---|
| 0 | 2023-02-13 00:00:00.000 +01:00 | 5442010239090746007 | 52.84819 |
| 1 | 2023-02-13 00:00:00.000 +01:00 | 4917786378639043296 | 29.67386 |
| 2 | 2023-02-13 00:00:00.000 +01:00 | 4762482310382009633 | 30.2523 |
[22]:
df_pipes_results["QMAV"]=df_pipes_results["QMAV"].astype(float)
[23]:
df_pipes_results["QMAV"]=df_pipes_results["QMAV"].abs()
[24]:
df_pipes_results=df_pipes_results.rename(columns={"QMAV": "QMAVAbs"})
Merge
[25]:
df_pipes = pd.merge(
    df_pipes_metadata,
    df_pipes_results,
    on="tk",
    how="outer"
)
[26]:
df_pipes=df_pipes[df_pipes["Kvr"] == "1"]
[27]:
df_pipes.head(3)
[27]:
| tk | DN | Kvr | geometry | fkKI | fkKK | timestamp | QMAVAbs | |
|---|---|---|---|---|---|---|---|---|
| 25 | 4615723899944629797 | 999 | 1 | LINESTRING (713738.296567236 5579219.90221333,... | 5129584372458662150 | 5332825919690090061 | 2023-02-13 00:00:00.000 +01:00 | 3.667083e-10 |
| 26 | 4615723899944629797 | 999 | 1 | LINESTRING (713738.296567236 5579219.90221333,... | 5129584372458662150 | 5332825919690090061 | 2023-02-13 01:00:00.000 +01:00 | 1.440640e-09 |
| 27 | 4615723899944629797 | 999 | 1 | LINESTRING (713738.296567236 5579219.90221333,... | 5129584372458662150 | 5332825919690090061 | 2023-02-13 02:00:00.000 +01:00 | 1.414446e-09 |
Plotting Constants
[28]:
def parse_point_string(s):
    # Extract numbers from the string using regex
    match = re.match(r'POINT\s*\(\s*([-\d\.]+)\s+([-\d\.]+)\s*\)', s)
    if match:
        x, y = float(match.group(1)), float(match.group(2))
        return Point(x, y)
    else:
        return None
[29]:
df_consumer['geometry'] = df_consumer['geometry'].apply(parse_point_string)

x_mean = df_consumer['geometry'].apply(lambda p: p.x if p else None).mean()
y_mean = df_consumer['geometry'].apply(lambda p: p.y if p else None).mean()
Change datatypes
[30]:
df_pipes['DN'] = pd.to_numeric(df_pipes['DN'], errors='coerce')
df_pipes['QMAVAbs'] = pd.to_numeric(df_pipes['QMAVAbs'], errors='coerce')
Filter rows
[31]:
df_pipes = df_pipes[df_pipes['DN'] != 999]
Turn into gdf
[32]:
df_pipes['geometry'] = df_pipes['geometry'].apply(wkt.loads)
[33]:
gdf_pipes = gpd.GeoDataFrame(df_pipes, geometry='geometry')
[34]:
gdf_pipes=gdf_pipes.set_crs(epsg=4326, inplace=True)
[35]:
gdf_pipes.head(3)
[35]:
| tk | DN | Kvr | geometry | fkKI | fkKK | timestamp | QMAVAbs | |
|---|---|---|---|---|---|---|---|---|
| 75 | 4621904482639719098 | 200 | 1 | LINESTRING (713283.93228 5578718.12301, 713299... | 5106194195554624313 | 5416743601805578486 | 2023-02-13 00:00:00.000 +01:00 | 86.89403 |
| 76 | 4621904482639719098 | 200 | 1 | LINESTRING (713283.93228 5578718.12301, 713299... | 5106194195554624313 | 5416743601805578486 | 2023-02-13 01:00:00.000 +01:00 | 87.91040 |
| 77 | 4621904482639719098 | 200 | 1 | LINESTRING (713283.93228 5578718.12301, 713299... | 5106194195554624313 | 5416743601805578486 | 2023-02-13 02:00:00.000 +01:00 | 89.32416 |
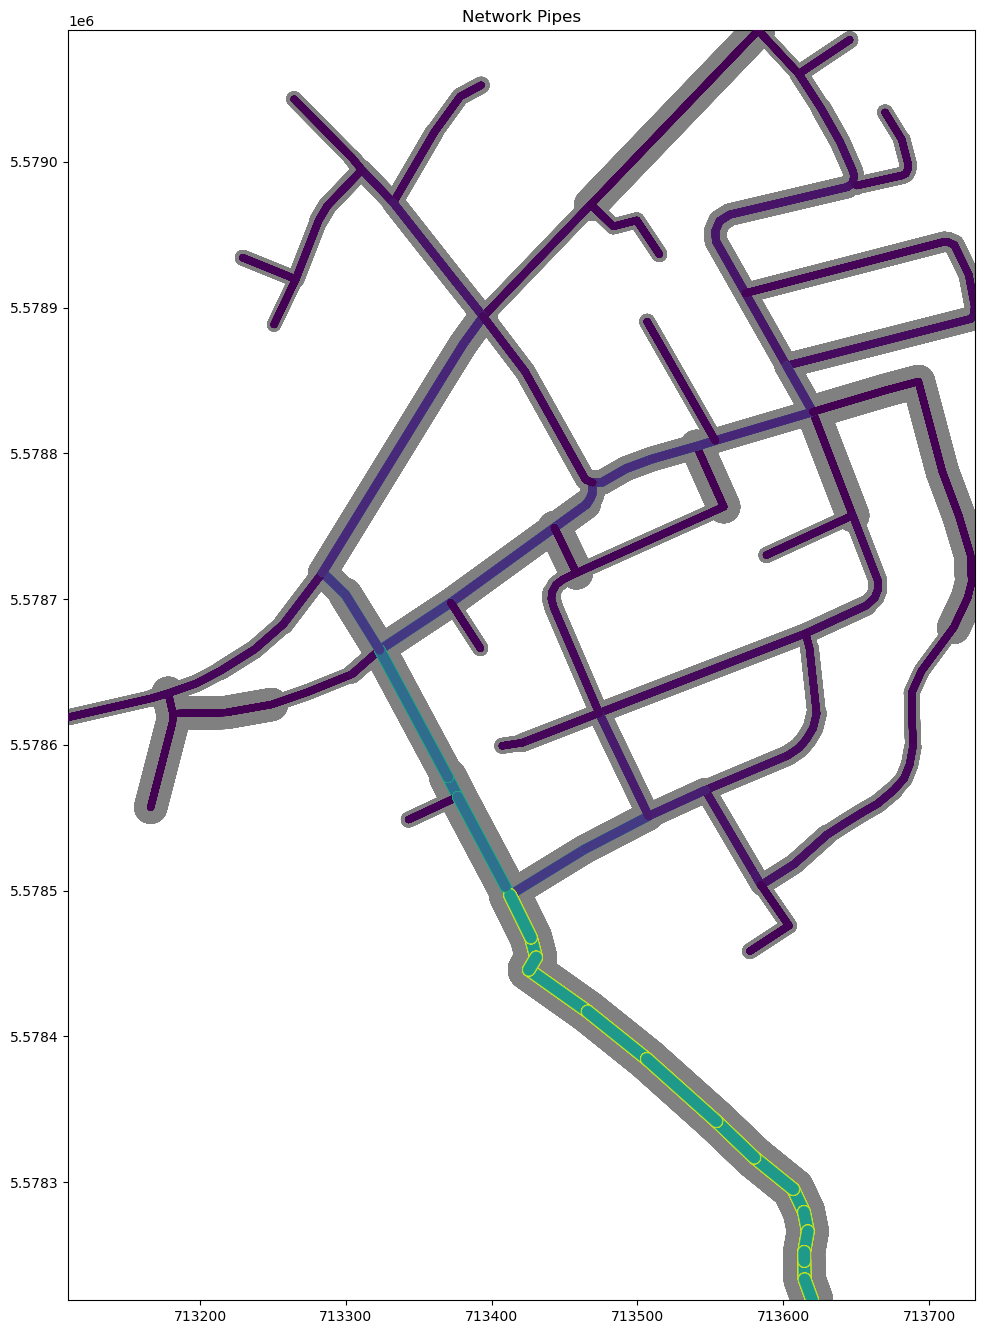
Plotting (WORK IN PROGRESS)
The function used below is not yet released.
[48]:
import matplotlib.pyplot as plt

fig, ax = plt.subplots(figsize=s3s.din_figsize("A3", orientation="portrait"))


# 1) Create the first layer (no color mixing)
layer1 = s3s.create_pipe_layer(
    gdf=gdf_pipes,
    geometry_col="geometry",
    cmap="viridis",
    width_scaling_col="DN",
    #color_mixing_col="QMAVAbs",
    min_width = 10,
    max_width = 30,
    default_color = (0.5, 0.5, 0.5, 1)
)

ax = layer1["axes"]  # grab axes from the first layer

layer2 = s3s.create_pipe_layer(
    gdf=gdf_pipes,
    ax=ax,
    geometry_col="geometry",
    cmap="viridis",
    width_scaling_col="QMAVAbs",
    color_mixing_col="QMAVAbs",
    min_width = 5,
    max_width = 10,
)

layer1["artist"].set_zorder(1)
layer2["artist"].set_zorder(10)

ax.set_title("Network Pipes")
plt.show()