Example 3: Pandapipes
This Example demonstrates how to generate a pandapipes network based on a SIR 3S model. When working with SIR 3S, pandapipes used to offer some freedom in creating simple DH models via Python, but with the introduction of the SIR 3S Toolkit, pandapipes is no longer necessary for this. Therefore the main benefit of pandapipes for SIR 3S users is for comparing calculations to SIR 3S results.
Note that the SIR 3S model we are using in this Example is quite simple.
In this Example we will first generate the pandapipes network manually by obtaining element dataframes for pipes and nodes via SIR 3S Toolkit. Then we will perform the same steps but built into one single Toolkit function.
Toolkit Release
[43]:
#pip install
Imports
SIR 3S Toolkit
Regular Import/Init
[44]:
SIR3S_SIRGRAF_DIR = r"C:\3S\SIR 3S Entwicklung\SirGraf-90-15-00-16_Quebec_x64" #change to local path
[45]:
import sir3stoolkit
[46]:
from sir3stoolkit.core import wrapper
[47]:
sir3stoolkit
[47]:
<module 'sir3stoolkit' from 'C:\\Users\\aUsername\\3S\\sir3stoolkit\\src\\sir3stoolkit\\__init__.py'>
[48]:
wrapper.Initialize_Toolkit(SIR3S_SIRGRAF_DIR)
Additional Import/Init for Alternative_Models class
[49]:
from sir3stoolkit.mantle import alternative_models
[50]:
s3s = alternative_models.Alternative_Models_SIR3S_Model()
Initialization complete
Additional
[51]:
import pandas as pd
[52]:
import pandapipes as pp
[53]:
from shapely import wkt
[54]:
import pandapipes.plotting as pp_plot
Open SIR 3S Model
[55]:
s3s.OpenModel(dbName=r"C:\Users\aUsername\3S\PT3S\PT3S\Examples\Example9_2.db3",
              providerType=s3s.ProviderTypes.SQLite,
              Mid="M-1-0-1",
              saveCurrentlyOpenModel=False,
              namedInstance="",
              userID="",
              password="")
Model is open for further operation
Generate Pandapipes network manually
Create pandapipes network
Nodes
[56]:
net = pp.create_empty_network(fluid="water")
[57]:
df_nodes_metadata = s3s.generate_element_metadata_dataframe(s3s.ObjectTypes.Node, ['Name', 'QmEin', 'bz.PhEin', 'Zkor', 'Ktyp'], geometry=True)
[2025-10-07 13:27:29,772] INFO in sir3stoolkit.mantle.dataframes: [metadata] Generating metadata dataframe for element type: ObjectTypes.Node
[2025-10-07 13:27:29,773] INFO in sir3stoolkit.mantle.dataframes: [metadata] Retrieved 9 element(s) of element type ObjectTypes.Node.
[2025-10-07 13:27:29,776] DEBUG in sir3stoolkit.mantle.dataframes: [Resolving Metadata Properties] Using 5 metadata properties.
[2025-10-07 13:27:29,777] INFO in sir3stoolkit.mantle.dataframes: [metadata] Retrieving metadata properties ['Name', 'QmEin', 'bz.PhEin', 'Zkor', 'Ktyp'], geometry...
[2025-10-07 13:27:29,777] INFO in sir3stoolkit.mantle.dataframes: [metadata] 0 non-empty end node columns were created)
[2025-10-07 13:27:29,783] INFO in sir3stoolkit.mantle.dataframes: [metadata] Done. Shape: (9, 7)
[58]:
df_nodes_results = s3s.generate_element_results_dataframe(s3s.ObjectTypes.Node, ['PH', 'T', 'QM'], s3s.GetTimeStamps()[0])
[2025-10-07 13:27:29,803] INFO in sir3stoolkit.mantle.dataframes: [results] Generating results dataframe for element type: ObjectTypes.Node
[2025-10-07 13:27:29,812] INFO in sir3stoolkit.mantle.dataframes: [Resolving Timestamps] Only static timestamp 2025-06-05 15:27:46.000 +02:00 is available
[2025-10-07 13:27:29,813] INFO in sir3stoolkit.mantle.dataframes: [results] Retrieved 9 tks.
[2025-10-07 13:27:29,816] INFO in sir3stoolkit.mantle.dataframes: [results] Using 3 result properties.
[2025-10-07 13:27:29,816] INFO in sir3stoolkit.mantle.dataframes: [results] Retrieving result properties...
[2025-10-07 13:27:29,820] INFO in sir3stoolkit.mantle.dataframes: [results] Done. Shape: (9, 5)
[59]:
df_nodes = pd.merge(df_nodes_metadata, df_nodes_results, on='tk', how='inner')
[60]:
df_nodes.head(3)
[60]:
| tk | Name | QmEin | bz.PhEin | Zkor | Ktyp | geometry | timestamp | PH | T | QM | |
|---|---|---|---|---|---|---|---|---|---|---|---|
| 0 | 5136506604482101815 | K0000 | 0 | 100 | 10 | PKON | POINT (149.99985694885254 500.00011920928955) | 2025-06-05 15:27:46.000 +02:00 | 100 | 0 | 400 |
| 1 | 5174640379525019821 | K0001 | 0 | 0 | 10 | QKON | POINT (349.99996423721313 600.00002384185791) | 2025-06-05 15:27:46.000 +02:00 | 99.99306 | 0 | 0 |
| 2 | 5665004361761998834 | K0002 | 0 | 0 | 10 | QKON | POINT (550.00007152557373 600.00002384185791) | 2025-06-05 15:27:46.000 +02:00 | 99.86531 | 0 | 0 |
[61]:
js = {}

for idx, row in df_nodes.iterrows():
    geom = wkt.loads(row["geometry"])
    x, y = geom.x, geom.y

    j = pp.create_junction(
        net,
        pn_bar=1 + float(row['PH']),
        tfluid_k=273.15 + float(row['T']),
        height_m=float(row['Zkor']),
        name=f"{row['Name']}~{row['tk']}"
    )

    # Assign geodata to junction_geodata table
    net.junction_geodata.at[j, "x"] = x
    net.junction_geodata.at[j, "y"] = y

    js[row['tk']] = j
[62]:
net.junction
[62]:
| name | pn_bar | tfluid_k | height_m | in_service | type | |
|---|---|---|---|---|---|---|
| 0 | K0000~5136506604482101815 | 101.00000 | 273.15 | 10.0 | True | junction |
| 1 | K0001~5174640379525019821 | 100.99306 | 273.15 | 10.0 | True | junction |
| 2 | K0002~5665004361761998834 | 100.86531 | 273.15 | 10.0 | True | junction |
| 3 | K0003~5185493728872360834 | 100.72040 | 273.15 | 10.0 | True | junction |
| 4 | K0004~4776931467066465913 | 100.72040 | 273.15 | 10.0 | True | junction |
| 5 | K0005~5229509832448527475 | 100.93705 | 273.15 | 10.0 | True | junction |
| 6 | K0006~5073490478136313655 | 100.87409 | 273.15 | 10.0 | True | junction |
| 7 | K0007~5417314986988666587 | 100.86626 | 273.15 | 10.0 | True | junction |
| 8 | K0008~5366461594623940805 | 100.86626 | 273.15 | 10.0 | True | junction |
pipes
[63]:
df_pipes_metadata = s3s.generate_element_metadata_dataframe(s3s.ObjectTypes.Pipe, ['L', 'Di', 'Rau', 'Name'], end_nodes=True, geometry=True)
[2025-10-07 13:27:29,918] INFO in sir3stoolkit.mantle.dataframes: [metadata] Generating metadata dataframe for element type: ObjectTypes.Pipe
[2025-10-07 13:27:29,919] INFO in sir3stoolkit.mantle.dataframes: [metadata] Retrieved 9 element(s) of element type ObjectTypes.Pipe.
[2025-10-07 13:27:29,921] DEBUG in sir3stoolkit.mantle.dataframes: [Resolving Metadata Properties] Using 4 metadata properties.
[2025-10-07 13:27:29,922] INFO in sir3stoolkit.mantle.dataframes: [metadata] Retrieving metadata properties ['L', 'Di', 'Rau', 'Name'], geometry, end nodes...
[2025-10-07 13:27:29,927] INFO in sir3stoolkit.mantle.dataframes: [metadata] 2 non-empty end node columns were created)
[2025-10-07 13:27:29,927] INFO in sir3stoolkit.mantle.dataframes: [metadata] Done. Shape: (9, 8)
[64]:
for idx,row in df_pipes_metadata.iterrows():
    raw_value = row["Rau"]
    row["Rau"] = float(str(raw_value).replace(",", "."))
[65]:
df_pipes_metadata.head(3)
[65]:
| tk | L | Di | Rau | Name | geometry | fkKI | fkKK | |
|---|---|---|---|---|---|---|---|---|
| 0 | 4762947358005495341 | 1000 | 450 | 0.25 | Rohr K0000 K0001 | LINESTRING (149.99985694885254 500.00011920928... | 5136506604482101815 | 5174640379525019821 |
| 1 | 5479123649362439650 | 1000 | 250 | 0.25 | Rohr K0002 K0003 | LINESTRING (550.00007152557373 600.00002384185... | 5665004361761998834 | 5185493728872360834 |
| 2 | 5367303884852200682 | 1000 | 250 | 0.25 | Rohr K0002 K0004 | LINESTRING (550.00007152557373 600.00002384185... | 5665004361761998834 | 4776931467066465913 |
[66]:
ps = {}

for idx, row in df_pipes_metadata.iterrows():
    geom = wkt.loads(row["geometry"])
    coords = list(geom.coords)

    # Create pipe
    p = pp.create_pipe_from_parameters(
        net,
        from_junction=js[row['fkKI']],
        to_junction=js[row['fkKK']],
        length_km=float(row['L']) / 1000.,
        diameter_m=float(row['Di']) / 1000.,
        k_mm=float(row['Rau']),
        name=f"{row['Name']}~{row['tk']}"
    )
    ps[row['tk']] = p

    net.pipe_geodata.at[p, "coords"] = coords
[67]:
net.pipe.head(3)
[67]:
| name | from_junction | to_junction | std_type | length_km | diameter_m | k_mm | loss_coefficient | u_w_per_m2k | text_k | qext_w | sections | in_service | type | |
|---|---|---|---|---|---|---|---|---|---|---|---|---|---|---|
| 0 | Rohr K0000 K0001~4762947358005495341 | 0 | 1 | None | 1.0 | 0.45 | 0.25 | 0.0 | 0.0 | NaN | 0.0 | 1 | True | pipe |
| 1 | Rohr K0002 K0003~5479123649362439650 | 2 | 3 | None | 1.0 | 0.25 | 0.25 | 0.0 | 0.0 | NaN | 0.0 | 1 | True | pipe |
| 2 | Rohr K0002 K0004~5367303884852200682 | 2 | 4 | None | 1.0 | 0.25 | 0.25 | 0.0 | 0.0 | NaN | 0.0 | 1 | True | pipe |
sources/sinks
[68]:
for idx, row in df_nodes.iterrows():
    ktyp = (row.get("Ktyp"))
    tk = row.get("tk")

    # Create source if Ktyp is PKON and PH > 0
    if ktyp == "PKON" and float(row.get("PH", 0)) > 0:
        pp.create_ext_grid(
            net,
            junction=js[tk],
            p_bar=1 + float(row["PH"]),
            t_k=273.15 + float(row["T"]),
            name=f"Src: {row['Name']}~{tk}"
        )

    # Create sink if Ktyp is QKON and QM < 0
    elif ktyp == "QKON" and float(row.get("QM", 0)) < 0:
        pp.create_sink(
            net,
            junction=js[tk],
            mdot_kg_per_s=abs(float(row["QM"])),
            name=f"Snk: {row['Name']}~{tk}"
        )
[69]:
net.ext_grid
[69]:
| name | junction | p_bar | t_k | in_service | type | |
|---|---|---|---|---|---|---|
| 0 | Src: K0000~5136506604482101815 | 0 | 101.0 | 273.15 | True | pt |
[70]:
net.sink
[70]:
| name | junction | mdot_kg_per_s | scaling | in_service | type | |
|---|---|---|---|---|---|---|
| 0 | Snk: K0003~5185493728872360834 | 3 | 100.0 | 1.0 | True | sink |
| 1 | Snk: K0004~4776931467066465913 | 4 | 100.0 | 1.0 | True | sink |
| 2 | Snk: K0007~5417314986988666587 | 7 | 100.0 | 1.0 | True | sink |
| 3 | Snk: K0008~5366461594623940805 | 8 | 100.0 | 1.0 | True | sink |
Calculate
[71]:
pp.pipeflow(net)
View Results
[72]:
net.res_junction
[72]:
| p_bar | t_k | |
|---|---|---|
| 0 | 101.000000 | 273.15 |
| 1 | 100.932708 | 273.15 |
| 2 | 99.491364 | 273.15 |
| 3 | 97.843832 | 273.15 |
| 4 | 97.843832 | 273.15 |
| 5 | 100.289209 | 273.15 |
| 6 | 99.578419 | 273.15 |
| 7 | 99.501563 | 273.15 |
| 8 | 99.501563 | 273.15 |
[73]:
net.res_pipe
[73]:
| v_mean_m_per_s | p_from_bar | p_to_bar | t_from_k | t_to_k | t_outlet_k | mdot_from_kg_per_s | mdot_to_kg_per_s | vdot_m3_per_s | reynolds | lambda | |
|---|---|---|---|---|---|---|---|---|---|---|---|
| 0 | 0.587940 | 101.000000 | 100.932708 | 273.15 | 273.15 | 273.15 | 93.496673 | -93.496673 | 0.093508 | 148220.775254 | 0.017522 |
| 1 | 2.037427 | 99.491364 | 97.843832 | 273.15 | 273.15 | 273.15 | 100.000000 | -100.000000 | 0.100012 | 285354.955734 | 0.019847 |
| 2 | 2.037427 | 99.491364 | 97.843832 | 273.15 | 273.15 | 273.15 | 100.000000 | -100.000000 | 0.100012 | 285354.955734 | 0.019847 |
| 3 | 1.927402 | 101.000000 | 100.289209 | 273.15 | 273.15 | 273.15 | 306.503327 | -306.503327 | 0.306540 | 485901.348599 | 0.017222 |
| 4 | 1.927402 | 100.289209 | 99.578419 | 273.15 | 273.15 | 273.15 | 306.503327 | -306.503327 | 0.306540 | 485901.348599 | 0.017222 |
| 5 | 0.628836 | 99.578419 | 99.501563 | 273.15 | 273.15 | 273.15 | 100.000000 | -100.000000 | 0.100012 | 158530.530963 | 0.017494 |
| 6 | 0.628836 | 99.578419 | 99.501563 | 273.15 | 273.15 | 273.15 | 100.000000 | -100.000000 | 0.100012 | 158530.530963 | 0.017494 |
| 7 | 1.904927 | 100.932708 | 99.491364 | 273.15 | 273.15 | 273.15 | 93.496673 | -93.496673 | 0.093508 | 266797.395457 | 0.019862 |
| 8 | -0.669731 | 99.491364 | 99.578419 | 273.15 | 273.15 | 273.15 | -106.503327 | 106.503327 | -0.106516 | 168840.286672 | 0.017470 |
[74]:
net.res_sink
[74]:
| mdot_kg_per_s | |
|---|---|
| 0 | 100.0 |
| 1 | 100.0 |
| 2 | 100.0 |
| 3 | 100.0 |
[75]:
net.res_ext_grid
[75]:
| mdot_kg_per_s | |
|---|---|
| 0 | -400.0 |
Plot
[76]:
pp_plot.simple_plot(net)
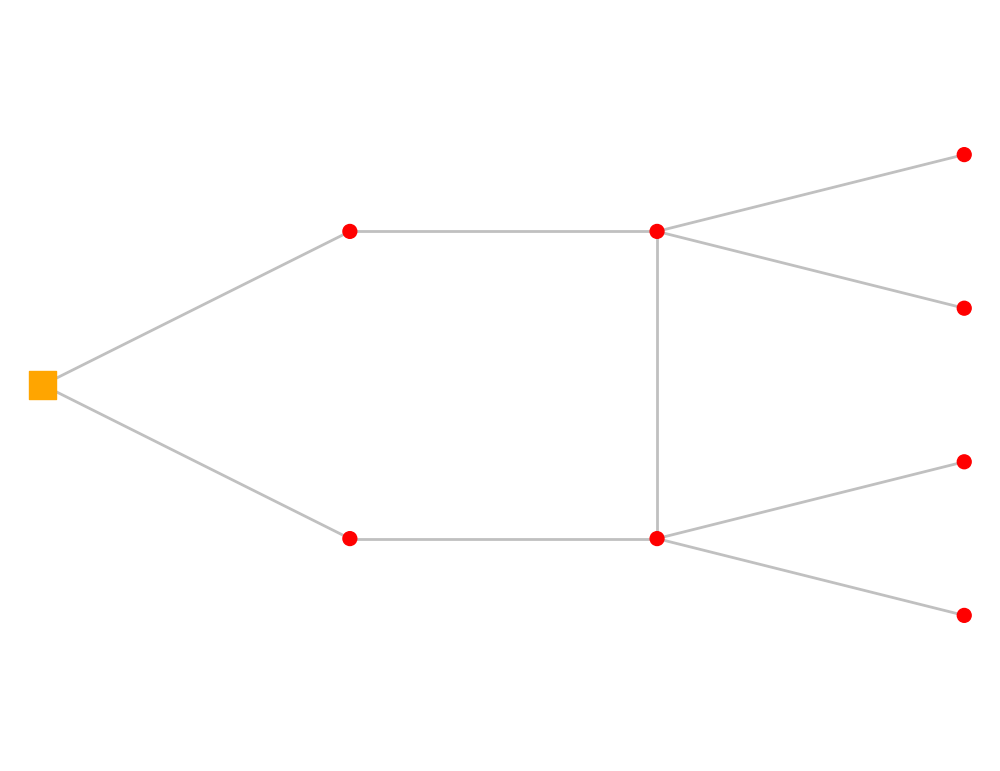
[76]:
<Axes: >
[77]:
import plotly.express as px

junctions = net.res_junction.copy()
junctions["x"] = net.junction_geodata["x"]
junctions["y"] = net.junction_geodata["y"]

fig = px.scatter(
    junctions,
    x="x", y="y",
    color="p_bar",
    hover_data=["p_bar"],
    title="Junctions: Pressure and Temperature",
    labels={"p_bar": "Pressure [bar]"}
)
fig.show()
Data type cannot be displayed: application/vnd.plotly.v1+json
The above depiction is not displayed in the online documentation.
Generating Pandapipes network using alternative_models() class from SIR 3S Toolkit
Create
[78]:
pp_net = s3s.SIR_3S_to_pandapipes()
[2025-10-07 13:27:30,428] INFO in sir3stoolkit.mantle.dataframes: [metadata] Generating metadata dataframe for element type: ObjectTypes.Node
[2025-10-07 13:27:30,429] INFO in sir3stoolkit.mantle.dataframes: [metadata] Retrieved 9 element(s) of element type ObjectTypes.Node.
[2025-10-07 13:27:30,430] DEBUG in sir3stoolkit.mantle.dataframes: [Resolving Metadata Properties] Using 5 metadata properties.
[2025-10-07 13:27:30,431] INFO in sir3stoolkit.mantle.dataframes: [metadata] Retrieving metadata properties ['Name', 'Zkor', 'QmEin', 'bz.PhEin', 'Ktyp'], geometry...
[2025-10-07 13:27:30,436] INFO in sir3stoolkit.mantle.dataframes: [metadata] 0 non-empty end node columns were created)
[2025-10-07 13:27:30,437] INFO in sir3stoolkit.mantle.dataframes: [metadata] Done. Shape: (9, 7)
[2025-10-07 13:27:30,483] INFO in sir3stoolkit.mantle.dataframes: [results] Generating results dataframe for element type: ObjectTypes.Node
[2025-10-07 13:27:30,501] INFO in sir3stoolkit.mantle.dataframes: [Resolving Timestamps] Only static timestamp 2025-06-05 15:27:46.000 +02:00 is available
[2025-10-07 13:27:30,503] INFO in sir3stoolkit.mantle.dataframes: [results] Retrieved 9 tks.
[2025-10-07 13:27:30,504] INFO in sir3stoolkit.mantle.dataframes: [results] Using 3 result properties.
[2025-10-07 13:27:30,504] INFO in sir3stoolkit.mantle.dataframes: [results] Retrieving result properties...
[2025-10-07 13:27:30,508] INFO in sir3stoolkit.mantle.dataframes: [results] Done. Shape: (9, 5)
[2025-10-07 13:27:30,536] INFO in sir3stoolkit.mantle.dataframes: [metadata] Generating metadata dataframe for element type: ObjectTypes.Pipe
[2025-10-07 13:27:30,537] INFO in sir3stoolkit.mantle.dataframes: [metadata] Retrieved 9 element(s) of element type ObjectTypes.Pipe.
[2025-10-07 13:27:30,539] DEBUG in sir3stoolkit.mantle.dataframes: [Resolving Metadata Properties] Using 4 metadata properties.
[2025-10-07 13:27:30,540] INFO in sir3stoolkit.mantle.dataframes: [metadata] Retrieving metadata properties ['L', 'Di', 'Rau', 'Name'], geometry, end nodes...
[2025-10-07 13:27:30,543] INFO in sir3stoolkit.mantle.dataframes: [metadata] 2 non-empty end node columns were created)
[2025-10-07 13:27:30,544] INFO in sir3stoolkit.mantle.dataframes: [metadata] Done. Shape: (9, 8)
Calculate
[79]:
pp.pipeflow(net)
View Results
[80]:
net.res_junction
[80]:
| p_bar | t_k | |
|---|---|---|
| 0 | 101.000000 | 273.15 |
| 1 | 100.932708 | 273.15 |
| 2 | 99.491364 | 273.15 |
| 3 | 97.843832 | 273.15 |
| 4 | 97.843832 | 273.15 |
| 5 | 100.289209 | 273.15 |
| 6 | 99.578419 | 273.15 |
| 7 | 99.501563 | 273.15 |
| 8 | 99.501563 | 273.15 |
[81]:
net.res_pipe
[81]:
| v_mean_m_per_s | p_from_bar | p_to_bar | t_from_k | t_to_k | t_outlet_k | mdot_from_kg_per_s | mdot_to_kg_per_s | vdot_m3_per_s | reynolds | lambda | |
|---|---|---|---|---|---|---|---|---|---|---|---|
| 0 | 0.587940 | 101.000000 | 100.932708 | 273.15 | 273.15 | 273.15 | 93.496673 | -93.496673 | 0.093508 | 148220.775254 | 0.017522 |
| 1 | 2.037427 | 99.491364 | 97.843832 | 273.15 | 273.15 | 273.15 | 100.000000 | -100.000000 | 0.100012 | 285354.955734 | 0.019847 |
| 2 | 2.037427 | 99.491364 | 97.843832 | 273.15 | 273.15 | 273.15 | 100.000000 | -100.000000 | 0.100012 | 285354.955734 | 0.019847 |
| 3 | 1.927402 | 101.000000 | 100.289209 | 273.15 | 273.15 | 273.15 | 306.503327 | -306.503327 | 0.306540 | 485901.348599 | 0.017222 |
| 4 | 1.927402 | 100.289209 | 99.578419 | 273.15 | 273.15 | 273.15 | 306.503327 | -306.503327 | 0.306540 | 485901.348599 | 0.017222 |
| 5 | 0.628836 | 99.578419 | 99.501563 | 273.15 | 273.15 | 273.15 | 100.000000 | -100.000000 | 0.100012 | 158530.530963 | 0.017494 |
| 6 | 0.628836 | 99.578419 | 99.501563 | 273.15 | 273.15 | 273.15 | 100.000000 | -100.000000 | 0.100012 | 158530.530963 | 0.017494 |
| 7 | 1.904927 | 100.932708 | 99.491364 | 273.15 | 273.15 | 273.15 | 93.496673 | -93.496673 | 0.093508 | 266797.395457 | 0.019862 |
| 8 | -0.669731 | 99.491364 | 99.578419 | 273.15 | 273.15 | 273.15 | -106.503327 | 106.503327 | -0.106516 | 168840.286672 | 0.017470 |
[82]:
net.res_sink
[82]:
| mdot_kg_per_s | |
|---|---|
| 0 | 100.0 |
| 1 | 100.0 |
| 2 | 100.0 |
| 3 | 100.0 |
[83]:
net.res_ext_grid
[83]:
| mdot_kg_per_s | |
|---|---|
| 0 | -400.0 |
Plot
[84]:
import plotly.express as px

junctions = net.res_junction.copy()
junctions["x"] = net.junction_geodata["x"]
junctions["y"] = net.junction_geodata["y"]

fig = px.scatter(
    junctions,
    x="x", y="y",
    color="p_bar",
    hover_data=["p_bar"],
    title="Junctions: Pressure and Temperature",
    labels={"p_bar": "Pressure [bar]"}
)
fig.show()
Data type cannot be displayed: application/vnd.plotly.v1+json
The above depiction is not displayed in the online documentation.