Tutorial 71: Time Curves
This example demonstrates how to obtain necessary data and plot time curves.
SIR 3S Installation
[1]:
SIR3S_SIRGRAF_DIR = r"C:\3S\SIR 3S\SirGraf-90-15-00-20x64_Quebec-Upd1" #change to local path
Imports
[2]:
from sir3stoolkit.core import wrapper
[3]:
from sir3stoolkit.mantle import mantle
The wrapper package has to be initialized with reference to a SIR 3S (SirGraf) installation.
[4]:
wrapper.Initialize_Toolkit(SIR3S_SIRGRAF_DIR)
Additional imports
[5]:
import os
[6]:
import pandas as pd
…
Initialization
[7]:
s3s = mantle.SIR3S_Model_Mantle()
Initialization complete
Open Model
[8]:
dbFilePath=r"C:\Users\aUsername\3S\PT3S\PT3S\Examples\Example2.db3"
[9]:
s3s.OpenModel(dbName=dbFilePath,
              providerType=s3s.ProviderTypes.SQLite,
              Mid="M-1-0-1",
              saveCurrentlyOpenModel=False,
              namedInstance="",
              userID="",
              password="")
Model is open for further operation
Obtain Data
[10]:
object_types = [item for item in dir(s3s.ObjectTypes) if not (item.startswith('__') and item.endswith('__'))]
print(object_types)
['AGSN_HydraulicProfile', 'AirVessel', 'Arrow', 'Atmosphere', 'BlockConnectionNode', 'CalcPari', 'CharacteristicLossTable', 'CharacteristicLossTable_Row', 'Circle', 'Compressor', 'CompressorTable', 'CompressorTable_Row', 'ControlEngineeringNexus', 'ControlMode', 'ControlPointTable', 'ControlPointTable_Row', 'ControlValve', 'ControlVariableConverter', 'ControlVariableConverterRSTE', 'CrossSectionTable', 'CrossSectionTable_Row', 'DPGR_DPKT_DatapointDpgrConnection', 'DPGR_DataPointGroup', 'DPKT_Datapoint', 'DamageRatesTable', 'DamageRatesTable_Row', 'DeadTimeElement', 'Demand', 'DifferentialRegulator', 'DirectionalArrow', 'DistrictHeatingConsumer', 'DistrictHeatingFeeder', 'Divider', 'DriveEfficiencyTable', 'DriveEfficiencyTable_Row', 'DrivePowerTable', 'DrivePowerTable_Row', 'EBES_FeederGroups', 'EfficiencyConverterTable', 'EfficiencyConverterTable_Row', 'ElementQuery', 'EnergyRecoveryTable', 'EnergyRecoveryTable_Row', 'EnvironmentTemp', 'FWBZ_DistrictHeatingReferenceValues', 'FlapValve', 'FlowControlUnit', 'FluidQualityParamSet', 'FluidQualityParamSet_OS', 'FluidThermalPropertyGroup', 'FreeDuct', 'FunctionGenerator', 'FunctionTable', 'FunctionTable_Row', 'GasComponent', 'GasMixture', 'GeneralSection', 'Gravitation', 'HeatExchanger', 'HeatFeederConsumerStation', 'HeaterCooler', 'Histeresis', 'House', 'Hydrant', 'Integrator', 'LAYR_Layer', 'LoadFactorTable', 'LoadFactorTable_Row', 'LogicalComparison', 'LogicalStorage', 'MeasuredVariableTable', 'MeasuredVariableTable_Row', 'MinMaxSelection', 'Multiplier', 'NetValve', 'Node', 'NonReturnValvesTable', 'NonReturnValvesTable_Row', 'NumericalDisplay', 'ObjectContainerSymbol', 'OpenContainer', 'Oval', 'PARZ_TransientCalculationParameters', 'PhaseSeparation', 'PidController', 'Pipe', 'PipeGroup', 'PipeTable', 'PipeTable_Row', 'PipeVertex', 'Polygon', 'Polyline', 'PressureRegulator', 'PressureZone', 'Pt1Controller', 'Pump', 'PumpCharTable', 'PumpCharTable_Row', 'PumpGroup', 'PumpOfPumpGroup', 'PumpSpeedTable', 'PumpSpeedTable_Row', 'RART_ControlMode', 'REGP_ControlParameters', 'RMES_DPTS_RmesInternalDataPoint', 'Rectangle', 'RegulatorsTable', 'RegulatorsTable_Row', 'ReturnTemperaturTable', 'ReturnTemperaturTable_Row', 'RoundRectangle', 'SIRGRAF', 'SPLZ_TimeSeries', 'SafetyValve', 'SetpointDevice', 'SolarCollector', 'StandPipe', 'Street', 'SummingPoint', 'SwitchInBlock', 'TemperatureTable', 'TemperatureTable_Row', 'Text', 'ThermalOutputTable', 'ThermalOutputTable_Row', 'ThermophysPropTable', 'ThermophysPropTable_Row', 'TransitionSymbol', 'Transmitter', 'TransportVariable', 'USCH_UserDefinedProperties', 'Unknown', 'VARA_ColorScale', 'VARA_ROWS_WidthOrScale', 'VRCT_ViewRectangle', 'Valve', 'ValveLiftTable', 'ValveLiftTable_Row', 'VarFlowTable', 'VarFlowTable_Row', 'VarPressureTable', 'VarPressureTable_Row', 'VentOpenCloseTable', 'VentOpenCloseTable_Row', 'VentValve', 'VentilatedPressureAirVessel', 'WBLZ_ThermalBalance', 'WeatherDataTable', 'WeatherDataTable_Row']
Nodes
[11]:
nodes_tks = ["5471942051669438823", "5166327497394449628", "5667818255300782920", "5262999985134416180"]
[12]:
df_nodes_results = s3s.generate_element_results_dataframe(element_type=s3s.ObjectTypes.Node
                                                          ,tks=nodes_tks
                                                          ,properties=["PH"]
                                                          ,timestamps=None # all available simulation timestamps will be used
                                                          )
[2026-01-16 14:17:27,591] INFO in sir3stoolkit.mantle.dataframes: [results] Generating results dataframe for element type: ObjectTypes.Node
[2026-01-16 14:17:27,594] INFO in sir3stoolkit.mantle.dataframes: [Resolving Timestamps] No timestamps were given. Checking available simulation timestamps (SIR3S_Model.GetTimeStamps()[0]).
[2026-01-16 14:17:27,707] INFO in sir3stoolkit.mantle.dataframes: [Resolving Timestamps] 601 simulation timestamp(s) are available.
[2026-01-16 14:17:27,773] INFO in sir3stoolkit.mantle.dataframes: [Resolving Timestamps] 601 valid timestamp(s) will be used.
[2026-01-16 14:17:27,777] INFO in sir3stoolkit.mantle.dataframes: [Resolving tks] Retrieved 635 element(s) of element type ObjectTypes.Node.
[2026-01-16 14:17:27,778] INFO in sir3stoolkit.mantle.dataframes: [Resolving tks] 4 tks remain after filtering for given tks.
[2026-01-16 14:17:27,791] INFO in sir3stoolkit.mantle.dataframes: [results] Using 1 result properties.
[2026-01-16 14:17:27,866] INFO in sir3stoolkit.mantle.dataframes: [results] Retrieving result values...
[2026-01-16 14:17:31,356] INFO in sir3stoolkit.mantle.dataframes: [results] Done. Shape: (601, 4)
Vents
[13]:
vent_tks = ["5303247238968995258"]
[14]:
df_vent_results = s3s.generate_element_results_dataframe(element_type=s3s.ObjectTypes.FlapValve
                                                          ,tks=vent_tks
                                                          ,properties=["PHI", "QM"]
                                                          ,timestamps=None # all available simulation timestamps will be used
                                                          )
[2026-01-16 14:17:31,404] INFO in sir3stoolkit.mantle.dataframes: [results] Generating results dataframe for element type: ObjectTypes.FlapValve
[2026-01-16 14:17:31,407] INFO in sir3stoolkit.mantle.dataframes: [Resolving Timestamps] No timestamps were given. Checking available simulation timestamps (SIR3S_Model.GetTimeStamps()[0]).
[2026-01-16 14:17:31,563] INFO in sir3stoolkit.mantle.dataframes: [Resolving Timestamps] 601 simulation timestamp(s) are available.
[2026-01-16 14:17:31,847] INFO in sir3stoolkit.mantle.dataframes: [Resolving Timestamps] 601 valid timestamp(s) will be used.
[2026-01-16 14:17:31,849] INFO in sir3stoolkit.mantle.dataframes: [Resolving tks] Retrieved 4 element(s) of element type ObjectTypes.FlapValve.
[2026-01-16 14:17:31,850] INFO in sir3stoolkit.mantle.dataframes: [Resolving tks] 1 tks remain after filtering for given tks.
[2026-01-16 14:17:31,854] INFO in sir3stoolkit.mantle.dataframes: [results] Using 2 result properties.
[2026-01-16 14:17:32,589] INFO in sir3stoolkit.mantle.dataframes: [results] Retrieving result values...
[2026-01-16 14:17:34,475] INFO in sir3stoolkit.mantle.dataframes: [results] Done. Shape: (601, 2)
[15]:
df_vent_results.head(3)
[15]:
| tk | 5303247238968995258 | |
|---|---|---|
| name | Klappe K0013 K0014 | |
| end_nodes | ('5154852831768145370', '5018980228933582263', '-1', '-1') | |
| property | PHI | QM |
| timestamp | ||
| 2020-01-28 15:45:01.000 +01:00 | 56.41736 | 18.35320 |
| 2020-01-28 15:45:01.100 +01:00 | 56.40917 | 18.35296 |
| 2020-01-28 15:45:01.200 +01:00 | 56.40861 | 18.35280 |
Valves
[16]:
valves_tks = ["5430537691154258843"]
[17]:
df_valves_results = s3s.generate_element_results_dataframe(element_type=s3s.ObjectTypes.Valve
                                                          ,tks=valves_tks
                                                          ,properties=["QM"]
                                                          ,timestamps=None # all available simulation timestamps will be used
                                                          )
[2026-01-16 14:17:34,559] INFO in sir3stoolkit.mantle.dataframes: [results] Generating results dataframe for element type: ObjectTypes.Valve
[2026-01-16 14:17:34,561] INFO in sir3stoolkit.mantle.dataframes: [Resolving Timestamps] No timestamps were given. Checking available simulation timestamps (SIR3S_Model.GetTimeStamps()[0]).
[2026-01-16 14:17:34,688] INFO in sir3stoolkit.mantle.dataframes: [Resolving Timestamps] 601 simulation timestamp(s) are available.
[2026-01-16 14:17:34,794] INFO in sir3stoolkit.mantle.dataframes: [Resolving Timestamps] 601 valid timestamp(s) will be used.
[2026-01-16 14:17:34,794] INFO in sir3stoolkit.mantle.dataframes: [Resolving tks] Retrieved 9 element(s) of element type ObjectTypes.Valve.
[2026-01-16 14:17:34,804] INFO in sir3stoolkit.mantle.dataframes: [Resolving tks] 1 tks remain after filtering for given tks.
[2026-01-16 14:17:34,806] INFO in sir3stoolkit.mantle.dataframes: [results] Using 1 result properties.
[2026-01-16 14:17:34,843] INFO in sir3stoolkit.mantle.dataframes: [results] Retrieving result values...
[2026-01-16 14:17:36,293] INFO in sir3stoolkit.mantle.dataframes: [results] Done. Shape: (601, 1)
[18]:
df_valves_results.head(3)
[18]:
| tk | 5430537691154258843 |
|---|---|
| name | Ventil K0011 PST_out |
| end_nodes | ('5471942051669438823', '5355079936656060238', '-1', '-1') |
| property | QM |
| timestamp | |
| 2020-01-28 15:45:01.000 +01:00 | 36.70272 |
| 2020-01-28 15:45:01.100 +01:00 | 36.70224 |
| 2020-01-28 15:45:01.200 +01:00 | 36.70192 |
Concat
[19]:
df_results = pd.concat([df_nodes_results, df_vent_results, df_valves_results], axis=1, join="inner")
[20]:
df_results.head(3)
[20]:
| tk | 5471942051669438823 | 5166327497394449628 | 5667818255300782920 | 5262999985134416180 | 5303247238968995258 | 5430537691154258843 | |
|---|---|---|---|---|---|---|---|
| name | K0011 | 5143521_i | 791393_3_k | 1629686_0_i | Klappe K0013 K0014 | Ventil K0011 PST_out | |
| end_nodes | No end nodes on element type | No end nodes on element type | No end nodes on element type | No end nodes on element type | ('5154852831768145370', '5018980228933582263', '-1', '-1') | ('5471942051669438823', '5355079936656060238', '-1', '-1') | |
| property | PH | PH | PH | PH | PHI | QM | QM |
| timestamp | |||||||
| 2020-01-28 15:45:01.000 +01:00 | 10.59964 | 8.320659 | 6.477164 | 0.881641 | 56.41736 | 18.35320 | 36.70272 |
| 2020-01-28 15:45:01.100 +01:00 | 10.59981 | 8.320658 | 6.477123 | 0.881641 | 56.40917 | 18.35296 | 36.70224 |
| 2020-01-28 15:45:01.200 +01:00 | 10.59993 | 8.320656 | 6.477080 | 0.881639 | 56.40861 | 18.35280 | 36.70192 |
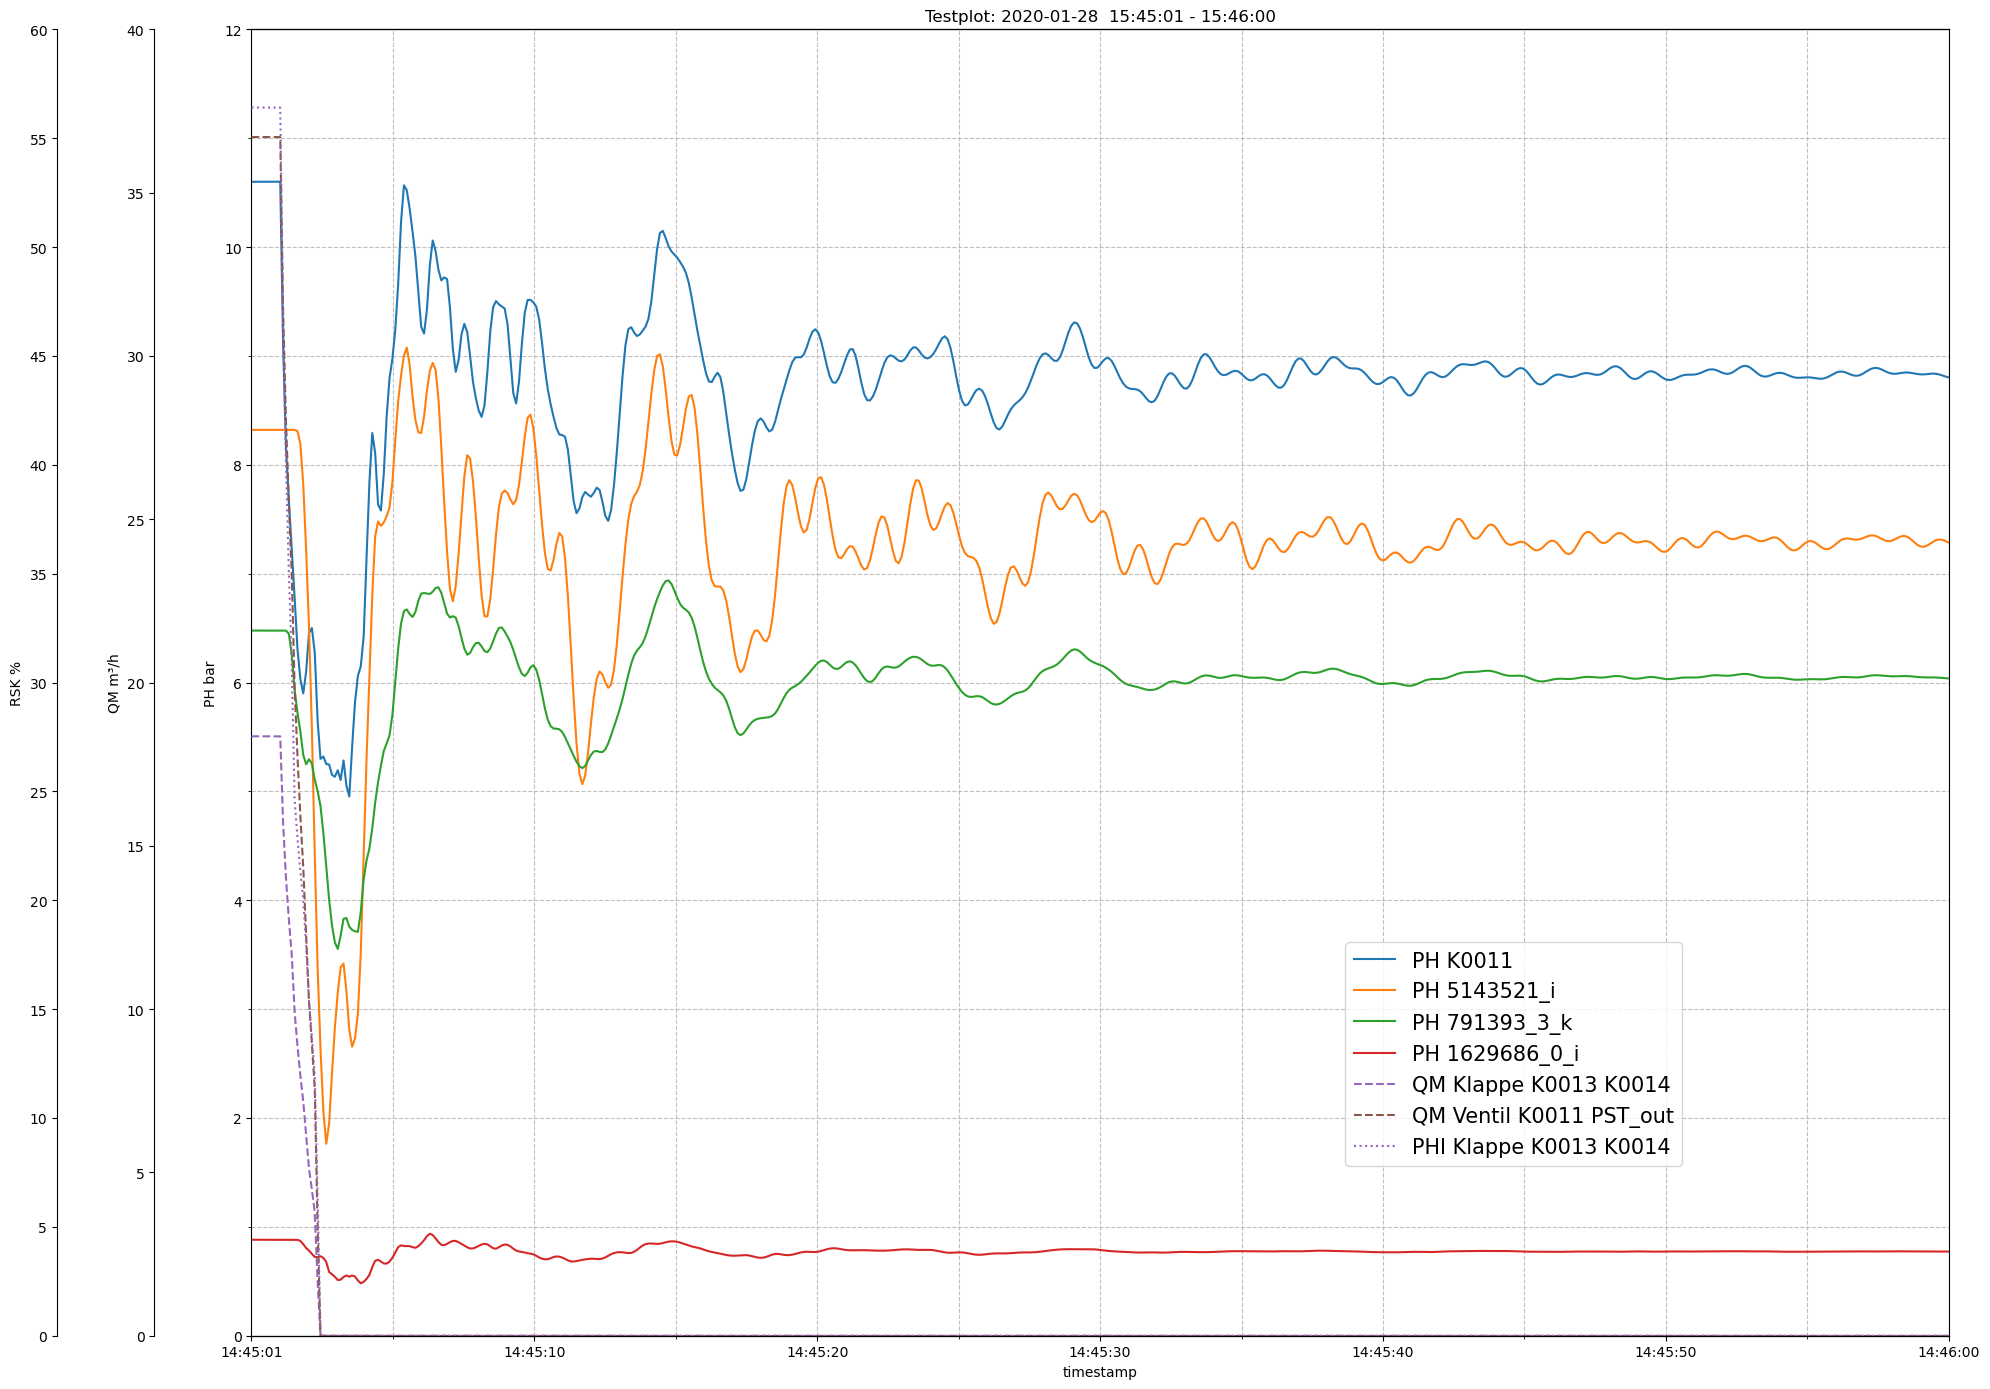
Plot
[21]:
df_results.head(3)
[21]:
| tk | 5471942051669438823 | 5166327497394449628 | 5667818255300782920 | 5262999985134416180 | 5303247238968995258 | 5430537691154258843 | |
|---|---|---|---|---|---|---|---|
| name | K0011 | 5143521_i | 791393_3_k | 1629686_0_i | Klappe K0013 K0014 | Ventil K0011 PST_out | |
| end_nodes | No end nodes on element type | No end nodes on element type | No end nodes on element type | No end nodes on element type | ('5154852831768145370', '5018980228933582263', '-1', '-1') | ('5471942051669438823', '5355079936656060238', '-1', '-1') | |
| property | PH | PH | PH | PH | PHI | QM | QM |
| timestamp | |||||||
| 2020-01-28 15:45:01.000 +01:00 | 10.59964 | 8.320659 | 6.477164 | 0.881641 | 56.41736 | 18.35320 | 36.70272 |
| 2020-01-28 15:45:01.100 +01:00 | 10.59981 | 8.320658 | 6.477123 | 0.881641 | 56.40917 | 18.35296 | 36.70224 |
| 2020-01-28 15:45:01.200 +01:00 | 10.59993 | 8.320656 | 6.477080 | 0.881639 | 56.40861 | 18.35280 | 36.70192 |
[22]:
fig, axes, used = s3s.plot_time_curves(
    df=df_results,
    start="2020-01-28 15:45:01.000 +01:00",
    end="2020-01-28 15:46:00.000 +01:00",
    properties=["PH", "QM", "PHI"],
    axis_labels=["PH bar", "QM m³/h", "RSK %"],
    ylims=[(0, 12), (0, 40), (0, 60)],
    tks_per_property=[
        ["5471942051669438823", "5166327497394449628", "5667818255300782920", "5262999985134416180"],
        ["5303247238968995258", "5430537691154258843"],
        ["5303247238968995258"],
    ],

    y_label_ticks=[7, 9, 13],
    y_grid_ticks=13,
    x_label_ticks=7,
    x_grid_ticks=13,

    legend=True,
    legend_in_figure=True,
    legend_loc="upper left",
    legend_coords=(0.67, 0.33),
    legend_fontsize=15,

    title_prefix="Testplot: ",
    show_title=True,

    axis_offset=70,
    linestyles=["-", "--", ":"],
    rotate_xticks=0,

    grid=True,
    grid_style="--",
    grid_alpha=0.8,

    missing="warn",
    logger=None,
)