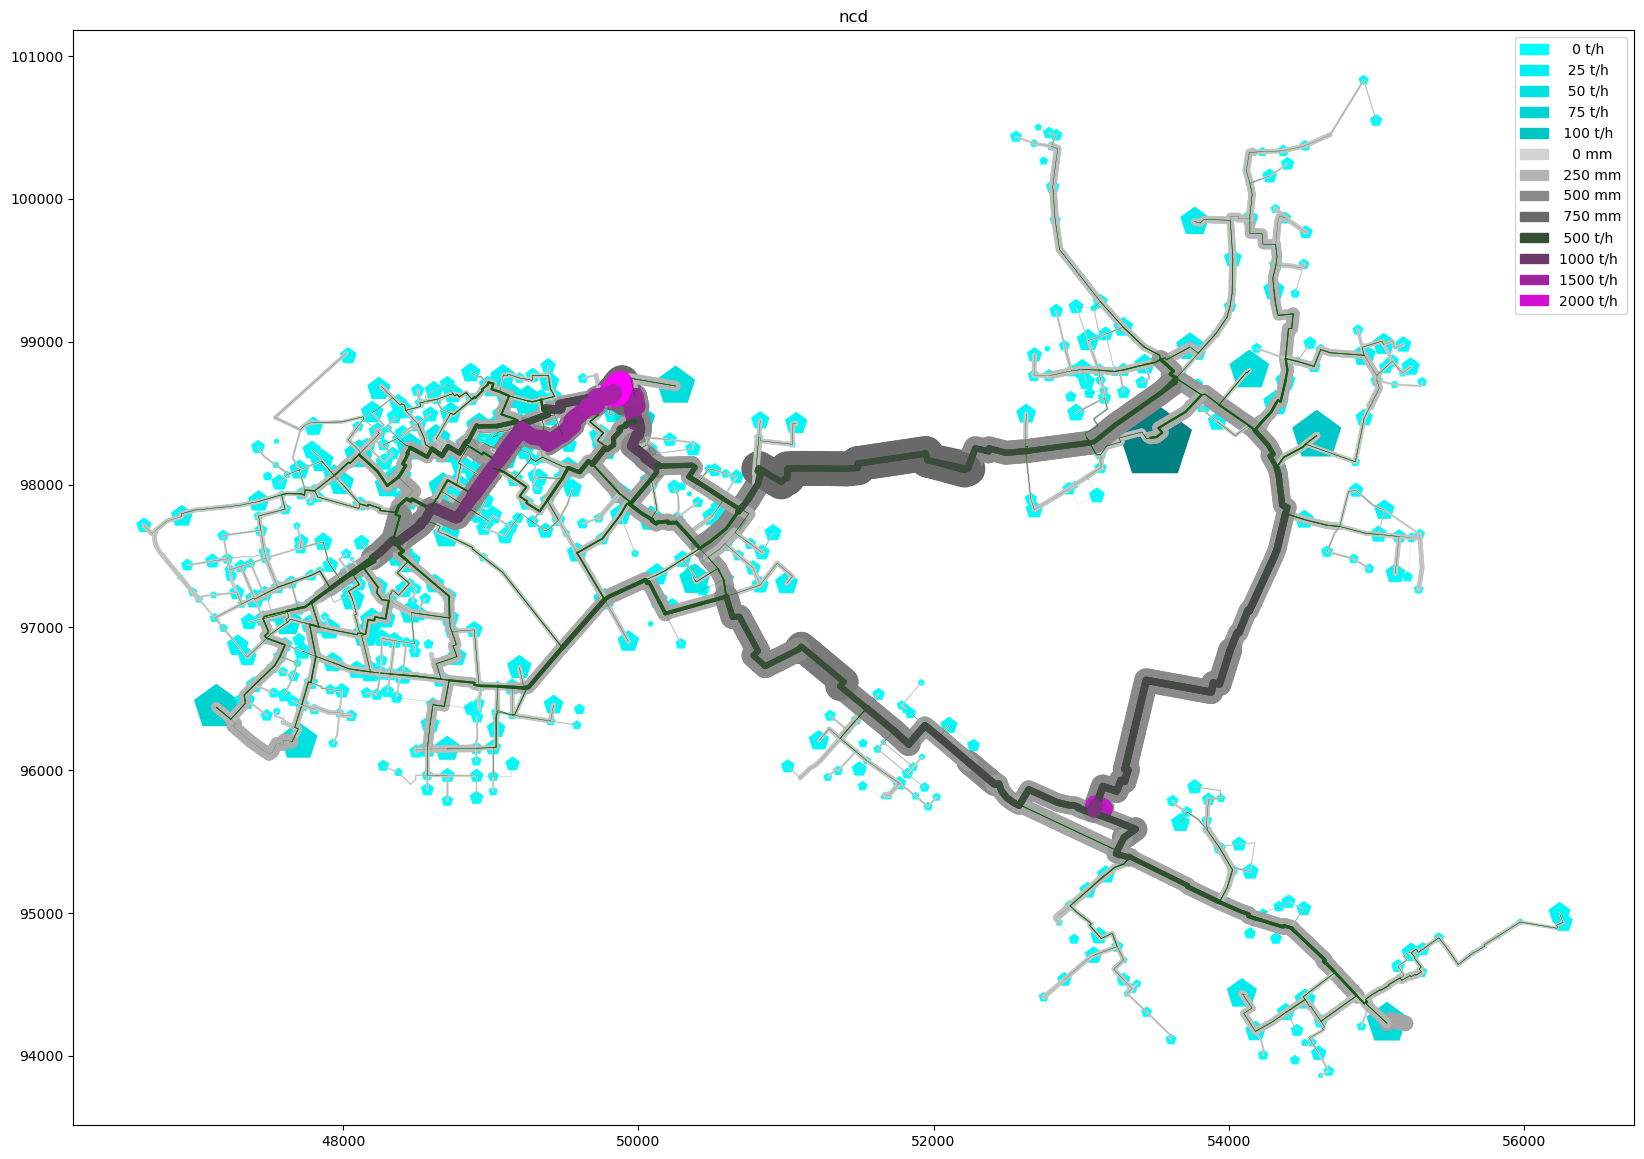
Tutorial 73: Network Color Depiction
This example demonstrates how to plot network color depictions (ncd).
SIR 3S Installation
[1]:
SIR3S_SIRGRAF_DIR = r"C:\3S\SIR 3S\SirGraf-90-15-00-20x64_Quebec-Upd1" #change to local path
Imports
[2]:
from sir3stoolkit.core import wrapper
[3]:
from sir3stoolkit.mantle import mantle
The wrapper package has to be initialized with reference to a SIR 3S (SirGraf) installation.
[4]:
wrapper.Initialize_Toolkit(SIR3S_SIRGRAF_DIR)
Additional imports
[5]:
import os
import matplotlib.pyplot as plt
from matplotlib.colors import LinearSegmentedColormap
import contextily as cx
…
Initialization
[6]:
s3s = mantle.SIR3S_Model_Mantle()
Initialization complete
Open Model
[7]:
dbFilePath=r"C:\Users\aUsername\3S\PT3S\PT3S\Examples\Example5.db3"
[8]:
s3s.OpenModel(dbName=dbFilePath,
              providerType=s3s.ProviderTypes.SQLite,
              Mid="M-1-0-1",
              saveCurrentlyOpenModel=False,
              namedInstance="",
              userID="",
              password="")
Model is open for further operation
Prep Data
District Heating consumers
[9]:
df_district_heating_consumer_model_data = s3s.generate_element_model_data_dataframe(s3s.ObjectTypes.DistrictHeatingConsumer
                                                                        ,properties=[]
                                                                        ,geometry=True)
[2026-01-10 17:39:48,781] INFO in sir3stoolkit.mantle.dataframes: [model_data] Generating model_data dataframe for element type: ObjectTypes.DistrictHeatingConsumer
[2026-01-10 17:39:48,789] INFO in sir3stoolkit.mantle.dataframes: [model_data] Retrieved 656 element(s) of element type ObjectTypes.DistrictHeatingConsumer.
[2026-01-10 17:39:48,812] INFO in sir3stoolkit.mantle.dataframes: [Resolving model_data Properties] Using 0 model_data properties.
[2026-01-10 17:39:48,812] INFO in sir3stoolkit.mantle.dataframes: [model_data] Retrieving geometry...
[2026-01-10 17:39:48,875] WARNING in sir3stoolkit.mantle.dataframes: [model_data] Spatial Reference Identifier (SRID) not defined in model. DataFrame cannot be transformed to GeoDataFrame but geometry column can be created independently of SRID. Returning regular DataFrame with a geometry column.
[2026-01-10 17:39:48,875] INFO in sir3stoolkit.mantle.dataframes: [model_data] Done. Shape: (656, 2)
[10]:
df_district_heating_consumer_results=s3s.generate_element_results_dataframe(element_type=s3s.ObjectTypes.DistrictHeatingConsumer
                                                           ,properties=["QM"]
                                                           ,timestamps=[0])
[2026-01-10 17:39:48,890] INFO in sir3stoolkit.mantle.dataframes: [results] Generating results dataframe for element type: ObjectTypes.DistrictHeatingConsumer
[2026-01-10 17:39:49,107] INFO in sir3stoolkit.mantle.dataframes: [Resolving Timestamps] Only static timestamp 2025-09-24 00:00:00.000 +02:00 is used
[2026-01-10 17:39:49,108] INFO in sir3stoolkit.mantle.dataframes: [Resolving Timestamps] 1 valid timestamp(s) will be used.
[2026-01-10 17:39:49,111] INFO in sir3stoolkit.mantle.dataframes: [Resolving tks] Retrieved 656 element(s) of element type ObjectTypes.DistrictHeatingConsumer.
[2026-01-10 17:39:49,112] INFO in sir3stoolkit.mantle.dataframes: [results] Using 1 result properties.
[2026-01-10 17:39:49,528] INFO in sir3stoolkit.mantle.dataframes: [results] Retrieving result values...
[2026-01-10 17:39:49,665] INFO in sir3stoolkit.mantle.dataframes: [results] Done. Shape: (1, 656)
[11]:
df_district_heating_consumer_results.columns = df_district_heating_consumer_results.columns.droplevel([1, 2])
df_district_heating_consumer_results = df_district_heating_consumer_results.T.unstack(level=0).T
df_district_heating_consumer_results = df_district_heating_consumer_results.droplevel(0, axis=0)
df_district_heating_consumer = df_district_heating_consumer_model_data.merge(on="tk",
                    how="outer",
                    right=df_district_heating_consumer_results)
[12]:
df_district_heating_consumer.head(3)
[12]:
| tk | geometry | QM | |
|---|---|---|---|
| 0 | 4615167946623235098 | POINT (48964.78656816362 97889.18677734208) | 9.808820 |
| 1 | 4615393182465694100 | POINT (46651.60694166463 97713.81722454002) | 8.018323 |
| 2 | 4616022158288753538 | POINT (54845.39768749467 97480.83261120686) | 3.134198 |
Pipes
[13]:
df_pipes_model_data=s3s.generate_element_model_data_dataframe(s3s.ObjectTypes.Pipe
                                                   ,properties=["DN"]
                                                   ,geometry=True)
[2026-01-10 17:39:49,712] INFO in sir3stoolkit.mantle.dataframes: [model_data] Generating model_data dataframe for element type: ObjectTypes.Pipe
[2026-01-10 17:39:49,716] INFO in sir3stoolkit.mantle.dataframes: [model_data] Retrieved 1672 element(s) of element type ObjectTypes.Pipe.
[2026-01-10 17:39:49,717] INFO in sir3stoolkit.mantle.dataframes: [Resolving model_data Properties] Using 1 model_data properties.
[2026-01-10 17:39:49,719] INFO in sir3stoolkit.mantle.dataframes: [model_data] Retrieving model_data properties ['DN'], geometry...
[2026-01-10 17:39:49,935] WARNING in sir3stoolkit.mantle.dataframes: [model_data] Spatial Reference Identifier (SRID) not defined in model. DataFrame cannot be transformed to GeoDataFrame but geometry column can be created independently of SRID. Returning regular DataFrame with a geometry column.
[2026-01-10 17:39:49,935] INFO in sir3stoolkit.mantle.dataframes: [model_data] Done. Shape: (1672, 3)
[14]:
df_pipes_results=s3s.generate_element_results_dataframe(element_type=s3s.ObjectTypes.Pipe
                                                           ,properties=["QMAV"]
                                                           ,timestamps=[0])
[2026-01-10 17:39:49,948] INFO in sir3stoolkit.mantle.dataframes: [results] Generating results dataframe for element type: ObjectTypes.Pipe
[2026-01-10 17:39:50,152] INFO in sir3stoolkit.mantle.dataframes: [Resolving Timestamps] Only static timestamp 2025-09-24 00:00:00.000 +02:00 is used
[2026-01-10 17:39:50,154] INFO in sir3stoolkit.mantle.dataframes: [Resolving Timestamps] 1 valid timestamp(s) will be used.
[2026-01-10 17:39:50,158] INFO in sir3stoolkit.mantle.dataframes: [Resolving tks] Retrieved 1672 element(s) of element type ObjectTypes.Pipe.
[2026-01-10 17:39:50,159] INFO in sir3stoolkit.mantle.dataframes: [results] Using 1 result properties.
[2026-01-10 17:39:50,239] INFO in sir3stoolkit.mantle.dataframes: [results] Retrieving result values...
[2026-01-10 17:39:50,611] INFO in sir3stoolkit.mantle.dataframes: [results] Done. Shape: (1, 1672)
[15]:
df_pipes_results.columns = df_pipes_results.columns.droplevel([1, 2])
df_pipes_results = df_pipes_results.T.unstack(level=0).T
df_pipes_results = df_pipes_results.droplevel(0, axis=0)
df_pipes = df_pipes_model_data.merge(on="tk",
                                    how="outer",
                                    right=df_pipes_results)
[16]:
df_pipes['QMAVAbs'] = df_pipes['QMAV'].abs()
[17]:
df_pipes.head(3)
[17]:
| tk | DN | geometry | QMAV | QMAVAbs | |
|---|---|---|---|---|---|
| 0 | 4613765641349500151 | 150 | LINESTRING (47478.00263683735 97484.9974701480... | -10.61157 | 10.61157 |
| 1 | 4614040293856762696 | 200 | LINESTRING (49756.350183295086 97621.546860662... | -135.87620 | 135.87620 |
| 2 | 4614199490723616754 | 150 | LINESTRING (50941.63085419123 97450.3987353445... | 19.20712 | 19.20712 |
Plotting
[18]:
def plot_Result_ncd(df_pipes, df_district_heating_consumer, axTitle='ncd'):
    fig, ax = plt.subplots(figsize=(16.54, 11.69))

    # Nodes (size+color by QM)
    nodes_patches_1 = s3s.plot_node_layer(
        ax=ax,
        gdf=df_district_heating_consumer,
        attribute='QM',
        colors=['cyan', 'teal'],
        marker_style='p',
        marker_size_factor=3000,
        legend_fmt='{:4.0f} t/h',
        legend_values=[0, 25, 50, 75, 100],
        zorder=1
    )

    # Pipes layer 1 (size+color by DN)
    pipes_patches_2 = s3s.plot_pipe_layer(
        ax=ax,
        gdf=df_pipes,
        attribute='DN',
        colors=['lightgray', 'dimgray'],
        legend_fmt='{:4.0f} mm',
        line_width_factor=25,
        legend_values=[0, 250, 500, 750],
        zorder=2
    )
    # Pipes layer 2 (size+color by QMAVAbs)
    pipes_patches_3 = s3s.plot_pipe_layer(
        ax=ax,
        gdf=df_pipes,
        attribute='QMAVAbs',
        colors=['darkgreen', 'magenta'],
        legend_fmt='{:4.0f} t/h',
        line_width_factor=20,
        legend_values=[0, 500, 1000, 1500, 2000],
        zorder=3
    )

    # Combine handles
    handles = []
    for h in (nodes_patches_1, pipes_patches_2, pipes_patches_3):
        if h:
            handles.extend(h)

    # Deduplicate legend by label
    if handles:
        seen = set()
        unique = []
        for h in handles:
            if h.get_label() not in seen:
                unique.append(h)
                seen.add(h.get_label())
        ax.legend(handles=unique, loc='best')

    ax.set_title(axTitle)
    plt.tight_layout()
[19]:
plot_Result_ncd(df_pipes, df_district_heating_consumer)
[2026-01-10 17:39:50,764] INFO in sir3stoolkit.mantle.plotting: [plot] Plotting nodes (size='None', color='None', attr='QM')
[2026-01-10 17:39:50,781] INFO in sir3stoolkit.mantle.plotting: [plot] Nodes: plotted 656 points.
[2026-01-10 17:39:50,791] INFO in sir3stoolkit.mantle.plotting: [plot] Plotting pipes (width='None', color='None', attr='DN')
[2026-01-10 17:39:50,869] INFO in sir3stoolkit.mantle.plotting: [plot] Pipes: plotted 1672 segments.
[2026-01-10 17:39:50,876] INFO in sir3stoolkit.mantle.plotting: [plot] Plotting pipes (width='None', color='None', attr='QMAVAbs')
[2026-01-10 17:39:50,945] INFO in sir3stoolkit.mantle.plotting: [plot] Pipes: plotted 1672 segments.